Implementing SVM for Classification and finding Accuracy in Python using datasets- Wine, Boston and Diabetes
Problem Statement: Implement SVM for performing classification and find its accuracy on the given data. (Using Python) (Datasets — Wine, Boston and Diabetes)
Link to the program and Datasets is given below
SVM stands for Support Vector Machine. SVM is a supervised machine learning algorithm that is commonly used for classification and regression challenges. Common applications of the SVM algorithm are Intrusion Detection System, Handwriting Recognition, Protein Structure Prediction, Detecting Steganography in digital images, etc.
In the SVM algorithm, each point is represented as a data item within the n-dimensional space where the value of each feature is the value of a specific coordinate.
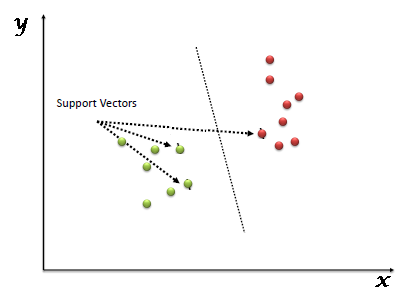
After plotting, classification has been performed by finding hype-plane which differentiates two classes. Refer below image to understand this concept.

Support Vector Machine algorithm is mainly used to solve classification problems. Support vectors are nothing but the coordinates of each data item. Support Vector Machine is a frontier that differentiates two classes using hyper-plane.
Working of Support Vector Algorithm
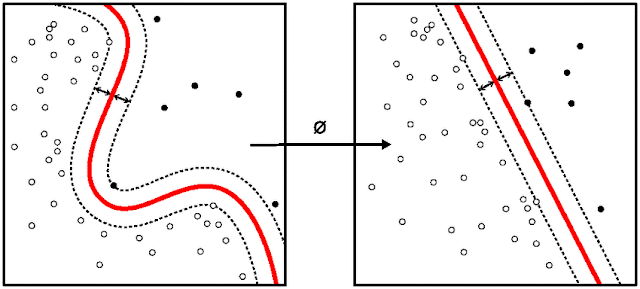
SVM works by mapping data to a high-dimensional feature space so that data points can be categorized, even when the data are not otherwise linearly separable. A separator between the categories is found, then the data are transformed in such a way that the separator could be drawn as a hyperplane.
Support Vector machines have some special data points which we call “Support Vectors” and a separating hyperplane which is known as “Support Vector Machine”. So, essentially SVM is a frontier that best segregates the classes. Support Vectors are the data points nearest to the hyperplane, the points of our data set which if removed, would alter the position of the dividing hyperplane. As we can see that there can be many hyperplanes which can segregate the two classes, the hyperplane that we would choose is the one with the highest margin.

The mathematical function used for the transformation is known as the kernel function. SVM supports the following kernel types:
• Linear
• Polynomial
• Radial basis function (RBF)
• Sigmoid
Program on SVM for performing classification and finding its accuracy on the given data:
Step 1: Import libraries

First, we will import the libraries needed for our program.
- We import svm and datasets from the sklearn Library
- Numpy for carrying out efficient mathematical computations
- accuracy_score from sklearn.metrics to predict the accuracy of the model and from sklearn.model_selection import train_test_split for splitting the data into a training set and testing set
Step 2: Add datasets, insert the desired number of features and train the model

Here is the code for importing inbuilt dataset. “iris” is the variable name in which we will be loading our required dataset.
We can also import the dataset from the location it is stored on your computer to a new variable.The pd.read_csv is used to read the csv file (dataset file). The following code shows the syntax:-
Iris = pd.read_csv(‘C:/Users/Kshitij Ved/Desktop/Iris.csv’)
In the next step X variable is loaded with iris.data[:, :2], in this we only take the first two features as input for training.
And the Y variable is loaded with iris.target, that is the output of the original data.
Then we Split arrays or matrices into a random train and test subset using train_test_split(). We provide the proportion of data to use as a test set and we can provide the parameter random_state, which is used to ensure repeatable results. Test_size is used to decide how much data to be given for testing to the model.
Moving along, we are now going to define our classifier…
We will be using the SVC (support vector classifier) SVM (support vector machine). Our kernel is going to be linear, and C is equal to 1. C is a valuation of “how badly” you want to properly classify, or fit, everything. We are going to just stick with 1 for now, which is a nice default parameter.
Step 3: Predicting the output and printing the accuracy of the model

In the next step we use the clf.predict(x_test), that is the classifier to predict the test results and then we print the accuracy score, In the above example, 76.31578947368422 is the predicted value of the model when we load iris as the data set.
Step 4: Finally plotting the classifier for our program

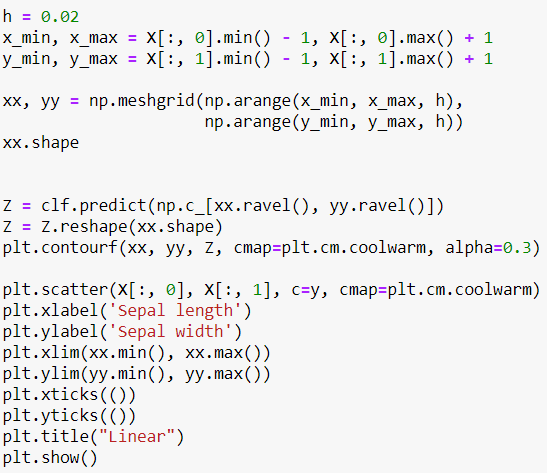
In this step, we will be plotting our classifier. Here the np.meshgrid() function is used to create a rectangular grid out of two given one-dimensional arrays representing the Cartesian indexing or Matrix indexing.
NumPy provides the reshape() function on the NumPy array object that can be used to reshape the data. In the case of reshaping a one-dimensional array into a two-dimensional array with one column, the tuple would be the shape of the array as the first dimension and 1 for the second dimension.
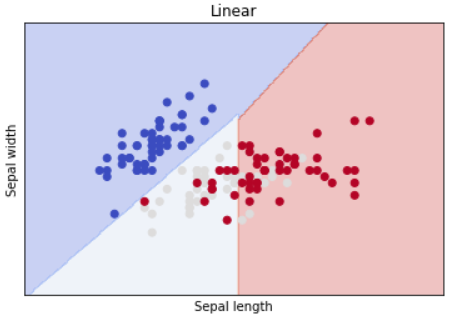
plt.scatter() is used to plot the points on the graph and plt.show() displays the graph.

Click here to download the Program and Datasets…
About Us
Thinksprout Infotech is leading IT Solutions company providing excellent services with great efforts. The Company also deals in Online Application and Custom Software Development. Moreover, we have an extensively experienced team in programming databases and back-end solutions. In the same vein, we develop user-friendly applications for our clients for better operations and outputs.
Partnered with
About Us
Thinksprout Infotech is leading IT Solutions company providing excellent services with great efforts. The Company also deals in Online Application and Custom Software Development. Moreover, we have an extensively experienced team in programming databases and back-end solutions. In the same vein, we develop user-friendly applications for our clients for better operations and outputs.
